generating SVG charts with couchdb
posted on 08 Dec 2009In this article I describe how I got couchdb to produce SVG charts using list functions
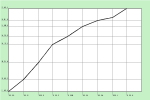
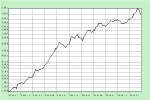
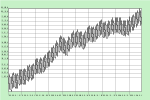
This post is long, so I'll report the results first:
Now go and read how I did it:
- generate some test data
- upload test data to couchdb
- create and manage a design document with couchapp
- write a simple view with map/reduce
- write a _list function and render the charts!
- Conclusions
Apache CouchDB is a document-oriented database server, accessible via a RESTful JSON API. It has some advanced features, such as the ability to write 'views' in a map/reduce fashion and to further transform the results using javascript. It's a young but very promising project.
Try this at home
You can browse browse or download all code discussed here. All comments and corrections are welcome.Generate some test data
To get started with this exploration we need some data to render, and a quick way to visualize it before our application is ready. This Python script generates a series of data points that simulate the goings of someone's bank account.# test_data.py. Usage: python test_data.py <simulation_length>
import sys
import random
days = int(sys.argv[1])
savings = 10000
pay = 2000
for i in range(0, days):
if ( i%30 == 0):
savings = savings + pay
savings = savings - random.randint(0, pay/16) - 2
print i, (int(savings))
$ python test_data.py 3000 > test_data.txt
$ cat test_data.txt
0 11947
1 11882
2 11813
...
Our final output will be similar to a line chart made with some bash and gnuplot:
#!/bin/sh
# gnuplot.sh generates a plot of a series piped in stdin
(echo -e "set terminal png size 750, 500\nplot \"-\" using 1:2 with lines notitle"
cat -
echo -e "end") | gnuplot
$ cat test_data.txt | sh gnuplot.sh > test_data.png
Upload test data data to couchdb
We need our data in json format so that it can be uploaded to couchdb. This python scripts converts each input line to a json object. Each object will become a document in couchdb. All lines are collected in the 'docs' array, to make the output compatible with couchdb bulk document api. It also adds a tag to each document, so it's easier to upload and manage multiple datasets.# data_to_json.py. builds json output suitable for couchdb bulk operations
import sys
import datetime
date = datetime.datetime(2000, 01, 01)
tag = sys.argv[1]
print '{"docs":['
for line in sys.stdin:
day, value = line.strip().split(' ')
datestr = (date + datetime.timedelta(int(day))).strftime("%Y-%m-%d")
if (day <> "0"): print ","
sys.stdout.write('{"tag":"%s", "date":"%s", "amount":%s}'%(tag, datestr, value)),
print '\n]}',$ cat test_data.txt | python data_to_json.py test-data > test_data.json
$ cat test_data.json
{"docs":[
{"tag":"test-data", "date":"2000-01-01", "amount":11896},
{"tag":"test-data", "date":"2000-01-02", "amount":11876},
....
{"tag":"test-data", "date":"2008-03-17", "amount":18703},
{"tag":"test-data", "date":"2008-03-18", "amount":18643}
]}
Create a new database with name svg-charts-demo
$ curl -i -X PUT http://localhost:5984/svg-charts-demo/
HTTP/1.1 201 Created
...
{"ok":true}
Upload the test data
$ curl -i -d @test_data.json -X POST http://localhost:5984/svg-charts-demo/_bulk_docs
HTTP/1.1 100 Continue

HTTP/1.1 201 Created
....
Verify that 3000 documents are in the database.
$ curl http://localhost:5984/svg-charts-demo/_all_docs?limit=0
{"total_rows":3000,"offset":3000,"rows":[]}
Create and manage a design document with couchapp
Design documents are special couchdb documents that contain application code such as views and lists. CouchApp is a set of scripts that makes it easy to create and manage design documents. In most cases installing couchapp is matter of one command. If you have any problems or want to know more, visit Managing Design Documents on the Definitive Guide.$ easy_install -U couchappThis command creates a new couchapp called svg-charts and installs it in couchdb
$ couchapp generate svg-charts

$ ls svg-charts/
_attachments  _id  couchapp.json  lists  shows  updates  vendor  views

$ couchapp push svg-charts http://localhost:5984/svg-charts-demo/
[INFO] Visit your CouchApp here:
http://localhost:5984/svg-charts-demo/_design/svg-charts/index.html
Write a simple view with map/reduce
This view will enable us to group the test data year, month or day and see the average for each group.// map.js
// key is array representing a date [year][month][day]
// value is each doc amount field (a number)
function(doc) {
// dates are stored in the doc as 'yyyy-mm-dd'
emit(doc.date.split('-'), doc.amount);
}// reduce.js
// this reduce function returns an array of objects
// {tot:total_value_for_group, count:elements_in_the_group}
// clients can than do tot/count to get the average for the group
// Keys are arrays [year][month][day], so count will always be 1 when group_level=3
function(keys, values, rereduce) {
if (rereduce) {
var result = {tot:0, count:0};
for (var idx in values) {
result.tot += values[idx].tot;
result.count += values[idx].count;
}
return result;
}
else {
var result = {tot:sum(values), count:values.length};
return result;
}
}
$ couchapp push svg-charts http://localhost:5984/svg-charts-demo/Call the view with group_level=1 to get the data grouped by year
$ curl http://localhost:5984/svg-charts-demo/_design/svg-charts/_view/by_date?group_level=1
{"rows":[
{"key":["2000"],"value":{"tot":4247068,"count":366}},
...
{"key":["2008"],"value":{"tot":1529286,"count":78}}
]}
Call the view with roup_level=2 to get the data grouped by month
$ curl http://localhost:5984/svg-charts-demo/_design/svg-charts/_view/by_date?group_level=2
{"rows":[
{"key":["2000","01"],"value":{"tot":343578,"count":31}},
{"key":["2000","06"],"value":{"tot":345282,"count":30}},
...
Call the view with roup_level=3 to get the data grouped by day. As all the keys are different at the third level, this returns a single row for each document.
$ curl -s http://localhost:5984/svg-charts-demo/_design/svg-charts/_view/by_date?group_level=3
{"rows":[
{"key":["2000","01","01"],"value":{"tot":11896,"count":1}},
{"key":["2000","01","04"],"value":{"tot":11747,"count":1}},
...
Same as above but limiting the response to a range of days
$ curl -s 'http://localhost:5984/svg-charts-demo/_design/svg-charts/_view/by_date?group_level=3
&startkey=\["2008","01","01"\]&endkey=\["2008","01","04"\]'
{"rows":[
{"key":["2008","01","01"],"value":{"tot":20050,"count":1}},
{"key":["2008","01","02"],"value":{"tot":20019,"count":1}},
{"key":["2008","01","03"],"value":{"tot":19974,"count":1}},
{"key":["2008","01","04"],"value":{"tot":19878,"count":1}}
]}
Write a _list function and render the charts!
function(head, req) {
	start({"headers":{"Content-Type" : "image/svg+xml"}});

	// some utility functions that print svg elements
	function svg(width, height) {
		return '<svg xmlns="http://www.w3.org/2000/svg" xmlns:xlink="http://www.w3.org/1999/xlink"'+
		' style="fill:black"'+
		' width="'+width+'" height="'+height+'">\n';
	}
	function line(x1, y1, x2, y2, color) {
		return '<line x1="'+x1+'" y1="'+y1+'" x2="'+x2+'" y2="'+y2+'"
			style="stroke-width: 0.2; stroke:'+color+'"/>\n';
	}
	function rect(x, y, width, height, color, fill) {
		return '<rect x="'+x+'" y="'+y+'" width="'+width+'" height="'+height+'"
			style="fill:'+fill+'; stroke:'+color+'"/>\n';
	}
	function text(x,y, text) {
		return '<text x="'+x+'" y="'+y+'" font-size="11"
			font-family="sans-serif">'+text+'</text>\n';
	}

	// import query parameters
	var x_size = req.query.width || 750;
	var y_size = req.query.height || 500;
	var level = parseInt(req.query.group_level);

	// find max and min values
	// collect values and labels
	var y_max = null;
	var y_min = null;
	var values = [];
	var labels = [];
	var count = 0;
	while(row = getRow()) {
		var value = Math.ceil(row.value.tot/row.value.count);
		if (y_max==null || value>y_max) { y_max=value; }
		if (y_min==null || value<y_min) { y_min=value; }
		values[count] = value;
		labels[count] = row.key.join('-');
		count++;
	}
	// calculate scalig factors
	var in_width = x_size-(2*pad);
	var in_height = y_size-(2*pad);
	var in_x_scale = in_width/count;
	var in_y_scale = in_height/(y_max-y_min);

	// free space surrounding the actual chart
	var pad = Math.round(y_size/12);

	send('<?xml version="1.0"?>');
	send(svg(x_size, y_size));

	// background box
	send(rect(1,1, x_size, y_size, '#C6F1C7', '#C6F1C7'));

	// chart container box
	send(rect(pad,pad, x_size-(2*pad), y_size-(2*pad), 'black','white'));

	// draw labels and grid
	var y_base = y_size - pad;
	var lastx = 0;
	var lasty = 0;
	for(var i=0; i<count; i++) {
		var x = pad+Math.round(i*in_x_scale);
		if (i==0 || x-lastx > (30+12*level)) {
			send(line(x, y_base+(pad/2), x, pad,'gray'));
			send(text(x+3, y_base + (pad/2), labels[i]));
			lastx = x;
		}
		var y = Math.round(y_base - ( (values[i]-y_min) * in_y_scale));
		if (i==0 || lasty-y > 15) {
			send(line(5, y, pad+in_width, y,'gray'));
			send(text(5, y-2, values[i]));
			lasty = y;
		}
	}
	// draw the actual chart
	send('<polyline style="stroke:black; stroke-width: '+ (4-level) +'; fill: none;" points="');
	for(var i=0; i<count; i++) {
		if (i>0) send(',\n');
		var x = pad+Math.round(i*in_x_scale);
		var y = Math.round(y_base - ( (values[i]-y_min) * in_y_scale));
		send( x + ' ' + y);
	}
	send('"/>');

	send('</svg>');
}curl http://localhost:5984/svg-charts-demo/_design/svg-charts/\ _list/chart-line/by_date?group_level=3 > chart-line_level-3.svg curl http://localhost:5984/svg-charts-demo/_design/\ _list/chart-line/by_date?group_level=2 > chart-line_level-2.svg curl http://localhost:5984/svg-charts-demo/_design/\ _list/chart-line/by_date?group_level=1 > chart-line_level-1.svg
Concusions
It worked.
I didn't expect to use a single list function for all grouping levels. I'm particularly happy of how it worked out, and even more considering that the whole thing is about 100 lines of code.
The output isn't too nice, but I think I can be made presentable with under 500 lines of code and some effort.
Couchdb is always a pleasure to work with and it goas a long way in minimizing "Time To something Done".


